Monthly Archives: June 2013

Rates of rates of change

Some instructors (like me!) like to foreshadow the ideas of concavity early in the semester. When I talk about rate of change, average and instantaneous, I like to throw out some discussion of the rate of change of the rate of change. This is a language puzzle for many students -- they may see that a function is increasing but need to think harder about whether it is increasingly increasing or decreasingly increasing. What does that all mean, anyway?! It's a great time to discuss precise mathematical language, communication skills, and the usefulness of equations. It is easy to be precise when symbolically indicating that a function is concave up, but our English language can obscure meaning here. Politicians certainly take advantage of this when discussing the decreased rate of growth in the budget or slowing the rate of budget cuts for social programs!

(Any examples a reader would like to publicize here? I know I've heard some great political lines like this but I cannot find a citation...)

This worksheet goes back to the air pressure activity introduced earlier. It is a fairly straightforward exercise in

  • computing average rates of change,
  • plotting secant lines, and
  • taking a first pass at the concept of concavity. 

Because it's straightforwardly computational rather than deeply conceptual, use this for a moment in class when you want students to work through the ideas but also want to give them a little mental break. It's a good time for getting a drink of water or chatting a bit about how things are going. Sometimes students need some computation and a stretch, as the ability to concentrate on mathematics for more than twenty minutes at a time takes development through repeated practice.

Rates Of Change: Mountains

I've been working on a post about interpretation of story problems and graphs, so that will probably make an appearance next week. It's also time to go toward derivative rules and derivative graphing. Good old-fashioned non-applied explanations of the derivative at a point and the derivative as a function are up to you, as I find students need a purely mathematical or formal explanation before applications. We'll revisit lynx and naproxen and hopefully add another story to the mix!

Aquifers and Rate of Change

Since childhood I'd had a mental image of an aquifer as a big underground lake, but it turns out that's not so accurate. Aquifers are layers of permeable rock or ground-up rock (dirt, silt, etc.) below the earth's surface that contain groundwater. When we sink a well down to water, we're trying to extract water from an aquifer. Any time you hear about groundwater usage (as opposed to surface water usage) you should think "aquifers!"

Why care about aquifers? Well, I like to drink water. When I visited Charleston, South Carolina and Savannah, Georgia this spring I learned that many wells in the region have been rendered useless because of saltwater intrusion -- if you pump out fresh water and you're near the coast, salty water comes in! Also, I would like it if my house did not collapse into a sinkhole. Apparently in 2010 about 130 sinkholes appeared in Florida, because of rapid removal of water from aquifers. That water in the spaces in the rock is pretty important. Last of all, many people enjoy lakefront property and recreation. The site just linked is for the White Bear Lake Restoration Association. Why does White Bear Lake in Minnesota need a restoration association? Because it's been shrinking dramatically, and now the docks are on dry land and lakefront property isn't on the lakefront any more. The US Geological Survey (USGS) and Minnesota DNR have concluded it's because of the draining of an aquifer that has contact with the lake.

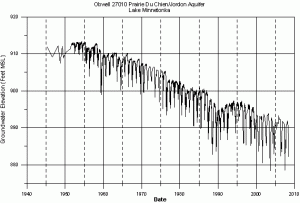
Alright. We like drinking water, not falling into sinkholes, and waterskiing rather than trudging through muck. How, then, do scientists look at aquifer health? One way to do this is through keeping track of well levels across a region and coupling that data with geological information about aquifer locations. The graph of water level for a well is called a hydrograph, and this one is shared directly from the Minnesota DNR page with their permission:

fig1ppt

The USGS maintains a groundwater watch page from which you can find all sorts of data for your local wells, and many states maintain similar pages. I used the Minnesota Water Level Monitoring Page to find the raw data for the above well, and then used the R program to create graphs for this worksheet on rate of change.

You'll notice a huge seasonal variation in well depth. Groundwater is commonly used for industrial applications, which may be year-round, but also for agriculture and lawn care, which are seasonal. According to one source, the city of Woodbury in Minnesota pumps around 5 million gallons a day in winter and 20 million gallons a day in summer.

This worksheet looks at real, messy data. Students are asked to estimate a lot of numbers and discuss their estimates with group members and the instructor. It's a good time for discussion of estimates and how we deal with real, messy data -- shill for your local statistics class here! The worksheet covers:

  • graphical approximation of average rate of change,
  • graphical approximation of instantaneous rate of change,
  • creating a linear model using approximations of rate of change,
  • and analyzing the model.

The graphs take up a lot of room but the questions are pretty straightforward, so print it double sided and it won't take that long to do in class. Have students work in groups and ask different groups to report their results by writing them on the board: they will have different numbers and can discuss the validity of each approximation. The last question, in particular, is open for a lot of debate: what does it mean for a well to "run dry" if there is seasonal variation in water level?

 Rate Of Change: Aquifers worksheet

Oh, if you've forgotten, remember we're still under federal budget sequestration: the USGS is going to have to turn off a number of streamgages used to monitor stream health and warn of flood events because it can't afford to keep them going...

Incorporating short projects

So far I've provided worksheets for group work in class, as many instructors are not able to modify the curriculum or grading system for the first-year calculus courses they teach. Worksheets work well in this situation because you can just slip them into a class discussion when you've covered the basic lessons, or give them out to students who are more advanced. On the other hand, even in somewhat inflexible courses sometimes you have the freedom to give students a take-home mini-project. Many of the topics I've covered so far could be the seed for a mini-project.

When I say mini-project, I'm talking about a project (somewhat open-ended) that is less than two pages. Less than two pages ensures mini-ness and makes it easier to grade.

An example of a mini-project would be:

  • Find your own population to model (subject to instructor approval) or use the lynx population in the Yukon between 1821 and 1934. State clearly in words what population you are modeling, what type of equation (trigonometric, exponential, linear) you are using, and why.
  • Write an equation that models the population using appropriate mathematical symbols.
  • Create a graph with the data and your model clearly indicated.
  •  Discuss the strengths and weaknesses of your model.

One possible rubric, then, grades students on writing, modeling, and graphically presenting data:

Sample grading rubric for mini-projects

In other classes I've used a rubric that grades on clarity, conciseness, correctness, and completeness, especially useful for writing-intensive exercises. Peer grading is another option for situations in which instructor grading will not work, and has the benefit of exposing students first-hand to the difficulty of reading the mathematical work of others!

(A gratuitous sample peer-review rubric from another class -- not calc!)

I find that a very concrete rubric for mini-projects helps students structure their exploration: they know they need a topic that they can (1) model with an equation and (2) draw a graph for. These mini-projects are to reward exploration, which is something many students taking calculus as a terminal class really fear!

I love mini-projects. They're a good way to allow some creativity in a rigid structure -- replace a quiz! They are low-stakes: when students send you the panicked email about how long it needs to be, you say, "Less than two pages -- with pictures." Often students can come up with really cool topics from other classes or other life experiences, so with a solid rubric they're actually fun to read and not so hard to grade.

Drugs in our waterways: the worksheet

As promised, here comes the worksheet for drugs in waterways. As I mentioned yesterday, this was the worksheet hardest to construct so far.

I did a lot of reading on pharmaceuticals in waterways and I liked the paper "Attenuation of Wastewater-Derived Contaminants in an Effluent-Dominated River," from 2006. It discusses the importance of biodegradation and photolysis in breaking down naproxen (brand name Aleve) in the Trinity River, which is full of water from a wastewater treatment plant much of the time. It's got some great graphs and a good set of supplementary calculations and information, which allowed me to pick out the pre-calculus problem inherent in the analysis.

The worksheet is set up as three pages that might be usable somewhat independently: the first page sets up the problem and asks about domain and range, the second asks about limits, and the third asks about piecewise functions. When used in a classroom, you're going to want to know that students will need calculators and could perhaps profitably use graphing software. (A little hand-graphing is good for them, though, as it's so useful later on.)

So:

  • limits,
  • continuity, and
  • piecewise functions.

Worksheet on Photolysis of Naproxen

First page: challenge them to think symbolically about domain and range, and physically. Negative depth in the river doesn't make sense. They don't need to know the values of alpha or k_{surf}, though they'd prefer to!

Second page: I've deliberately given a limit (as z goes to zero) that will not be easy using limit rules (unless there's a trick I haven't seen). It is very easy using L'Hopital's rule or a power series expansion of the exponential so tell students they will soon have tools to do this rigorously. For now, they can use numerical calculation and grapple with the idea of "limit." Students also already have the value at zero, given implicitly in problem 3 by the scientists. We have a removable discontinuity at z=0, always a somewhat challenging concept for students. The limit as z goes to infinity can be done with limit rules.

Third page: Piecewise functions! Some students like 'em, others hate 'em, and many mostly understand but don't know how to write 'em. Coach students through correct 'mathematical grammar' for piecewise functions. There's also a chance to practice writing nice coherent sentences explaining why a function is continuous at the end of the page. At every university or college I've taught at, students have wanted more examples of how to write mathematics -- this is a good chance!

Along the path to this worksheet, I learned why water is blue!

Ok. Off to enjoy some sunlight now. I'm going to wear my mineral sunscreen so that I don't have to worry about avobenzone sloughing off of me into my local waterways... Once limits and continuity are covered, we're only a few steps away from the definition of derivative.

Drugs in our waterways: teaser

This is definitely one of the more complex topics we'll be discussing on the blog. Physics can be so clean -- bodies of rock moving through space, atmospheric gas escaping -- but biology, especially when we start talking about ecosystems, can be so messy! I mean literally as well as figuratively: people who work on measuring the levels of pharmaceuticals in our waterways have to wade through muck, dig through algae, and get in boats!

The presence of pharmaceuticals and endocrine-disrupting compounds in our waterways is an issue that's only becoming more pressing. I'll concentrate on Minnesota because that's where I live. Remember that flap about water bottles containing bisphenol-A? Maybe you switched your water bottle -- but you can't get away from the fact that small quantities can now be found in over 40 percent of Minnesota lakes [1]. Don't take antidepressants at the moment? Well, maybe you'll get a little when you're swimming: venlafaxine (sold as Effexor) is found in 9.4 percent of stream water samples analyzed by the Minnesota Pollution Control Agency in 2010 [2] and amitriptyline is found in almost 30 percent of lakes randomly sampled in 2012 [1]. Disturbingly, cocaine is found in over 30 percent of lakes, too -- what are Minnesotans doing?! [1] And you'd think we'd have fewer mosquitos here given that DEET, the insect repellent, is found in over 70 percent of our lakes! [1]

While the amounts we're talking about are very tiny, they still disrupt fish and mussel life and reproduction. Strangely, fish exposed to some antidepressants are more aggressive predators. Frogs exposed to birth control chemicals can reverse sex. We don't really know what happens to humans exposed to frequent low-level chemical concentrations of this type, although there are disturbing preliminary results relating endocrine disruptors to obesity, diabetes, and endometriosis. We do know that the pharmaceutical industry is hugely important economically, and there is conversation around making the industry greener.

Ok: enough geeking out about the prevalence and importance of drugs in our waterways. Where's the math?

I'm working out a worksheet that will discuss photolysis, the breakdown of chemicals due to light exposure. The rate of photolysis depends on the clearness of the water at a given depth in the photic zone (the zone that light can reach), and this rate constant can be modeled by a

  • composition of a rational function and an exponential function.
  • This function gives a rate, even though we haven't done any differentiation.
  • I'm hoping to work in a page on limits as well.

However, this post is super-long already -- so I'll  stop! The worksheet should be up today or tomorrow (Tuesday).

[1] Pharmaceuticals and Endocrine Active Chemicals in Minnesota Lakes, released May 2013, online at MPCA site on water. Dramatic graph on page 6.

[2] Pharmaceuticals and Personal Care Products in Minnesota’s Rivers and Streams: 2010, released April 2013, online at MPCA site on water. Pages 2-3 discuss venlafaxine.

Lynx!

Trigonometry is often a terrifying topic for students taking a first calculus class in college. America's trig teaching seems a bit haphazard, and we can't assume students have a good grasp of periodic functions.

This summer project is clearly not offering a full calc curriculum, but instead offering supplemental material. A good lesson on the unit circle is a first step in any college calc discussion of trig. After that, though, students may find practice with a variety of trig problems useful. You can look at particle motion and springs and all sorts of mechanical applications, or you can use a cute and fuzzy animal that also has sharp teeth and claws.... the lynx!

A lot of arctic populations including lynx, snowshoe hare, and lemmings have cyclic population fluctuations and there is a lot of research about why this is. If you've got students in ecology you can ask them to tell you about this in more detail: this is a great topic for a small project or extra credit assignment.

I love this family of examples: there is so much room for discussion of the real world, from foxes and rabbits in my own neighborhood to the wolves and moose of Isle Royale. The examples work so well from precalculus through multivariable, linear algebra, and differential equations. Students can easily experiment with changing parameters in their models, using Excel or more sophisticated programs. And it's all about the circle of life, one of the most compelling stories we as humans know!

Alright then. To the worksheet. I may be a bit dissatisfied with this one yet for reasons I'll outline below. The instructor should display a graph of the actual data, included below. Students then work through 

  • constructing a trigonometric function from the amplitude and period, 
  • considering the shape of the actual data as they construct the function, and
  • critiquing their model at the end.

As so often is true in modelling, our first instinct -- the sinusoidal function -- is not actually most accurate. If you've got access to the lynx data (you can also find it as a dataset in R, the stats program) you can check that the logarithm of the data is actually more sinusoidal! Look at the long troughs in the the non-log graph, along with the sharper peaks. With students you can use the idea of symmetry to discuss why a sinusoidal approximation is not the best for the non-log-transformed data: the graph does not have reflect-and-glide symmetry, unlike cosine and sine. I, though, honestly don't yet know a good mathematical explanation for the fact that the logarithm of the population data has a more sinusoidal shape. I'd love to hear one.

Worksheet constructing periodic function for lynx trapping

Plot of lynx trapping over time

Plot of logarithm of lynx trapping over time

I know that someone other than me has looked at this blog in the past week! Question of the day: do you use cute fuzzy animals to increase interest and engagement in class?

Group work and a power function for atmospheric pressure

We instructors of calculus know that linear models aren't everything, even though linearization is in some sense the point of the differential calculus. Since the first week of many calculus courses begins with a precalc review including power functions, I'll just move smoothly along to a power function model for atmospheric pressure! (Don't worry: we'll get to lynx trapping in the Yukon for a trig review activity in a day or two -- not everything is about physics or the atmosphere.)

It's always important to remind students about the difference between power functions and exponential functions, not least because they've got different differentiation rules. One nice way to look at power functions and exponential functions is by looking at growth -- we know that  x^2 and  2^x grow at very different rates. But everyone does that... and I was having fun with atmospheric pressure! This worksheet has a very funky power -- 1/0.19... -- and might be a good way to acquaint students with the messiness of real-life models. I will return to this topic when we get to derivative and integrals, too, because this equation is actually fairly easy to derive.

The worksheet below tries to foreshadow the idea of the derivative fairly heavily. It asks about 

  • composition of functions,
  • intervals of increase and decrease, and
  • slope of the tangent line.

As usual, I try to incorporate a bit of writing and thinking about the meaning of a model as well. There's definitely room for discussion around these worksheets.

In addition, you might notice that there's a bit of tedious calculation at the beginning. Why would an enlightened modern instructor do that? I like to give these worksheets to students in groups. At the beginning of the semester I always give a student survey asking about past math experience, major, problems or gifts I should know about, outside interests, favorite dessert, favorite color.  In the first few weeks of class I use this to arrange student groups and ask them to figure out how I've grouped them (by major, dessert, color, last name...!). Giving them just a bit more tedious calculation than most people would enjoy gives me a chance to encourage and incentivize conversation within groups even more.

This week's worksheet: atmospheric pressure as a power function!

A better model: power function

There's also a natural place to discuss solving for the inverse function here, and I might add a worksheet about that soon too.

Do you use group work or worksheets with students? Why or why not? What kinds of constraints do you have to deal with in considering group work?

A linear beginning

I've taught calculus now at several different college and universities. Calc is a funny class these days: students who have done quite well in high school math now often enter a linear algebra or multivariable calculus class directly, so students in calculus come from a variety of backgrounds but often did not have a good high school math experience. Often students in college calculus classes took the AP calculus offered in high school with varying results. A surprisingly high number of students I've seen in college calc did not even take precalculus in high school. This is generally a recipe for disaster.

During the fall and spring semesters I start every calculus section with a conversation about what calculus is good for and what other classes a student could take to fulfill requirements. I like to push statistics and math for liberal arts majors courses: statistics is becoming crucial to survival and innovation in a number of fields, from finance to medicine, and math for liberal arts majors classes often expose a student to graph theory, voting theory, and other useful techniques for looking at problems we all encounter in life. There is so much beautiful mathematics! Don't get stuck on calculus as the only way forward!

After that, it's time to start with review. I phrase it as a warm-up: here are things you will need to dredge out of your brain and reacquaint yourself with to be successful in calculus. First is the point-slope equation for a line.

The worksheet attached explores the change in atmospheric pressure as we increase in altitude from San Francisco to Denver to the peak of Mount Everest. In it, students develop a linear approximation for pressure in kilopascals from two data points (no use of derivatives), and then examine the validity of their approximation. Use this to explore:

  • how to work through a word problem
  • the point-slope equation for a line, introducing the idea of slope as rate of change
  • critical thinking about models: comparing theoretical and actual results can point out weaknesses in a model!

When discussing this worksheet, remember that temperature, humidity, and weather patterns affect the pressure of our atmosphere as well. Some of the lowest pressure readings ever taken near the Earth's surface have been in the centers of hurricanes, for instance. In calculus we study "baby problems" so that we can eventually build up the techniques to model situations more accurately -- like scales before playing Beethoven.

Linear Functions -- Head in the Clouds Worksheet

How do you start out your calculus classes in the first few days? How much review do you do? Do you think all of your students are best served by calculus?

Approaching calculus through an earth-lens

Calculus is the study of 

  • the rate of change of quantities,
  • the net change of quantities, and
  • relations between quantities and their rate of change.

Our planet earth, too, is all about change: we see it in the weather, animal populations, even the height of mountains over time! With such a natural overlap in subject matter, the calculus of the mathematics of planet earth is ripe for more exploration.

In this summer blog, I'm planning to look at a few different stories:

  • the periodic fluctuations in the populations of arctic lemmings and snowshoe hares, and possible effects of climate instability
  • our atmosphere: you probably know that it's harder to get enough oxygen at the top of Mount Everest, but did you know we have a "gas leak"?
  • water: the most important resource for human existence and a major  factor in climate. How are we using water and what is the health of our aquatic ecosystems?

As we go, there will certainly be some side trips. I love learning about different things, and along the way I've discovered that chickens adjust their dry matter intake based on temperature and that ibuprofen in waterways is degraded by sunlight. Right there we've got an optimization problem and a related rates project! If you've got suggestions or comments, let me know via email or the comments below each post. My hope is that this blog will serve as a resource for instructors and provide a space for conversation for professors and teachers of calculus.