
The MAA North Central Section is having a summer short course on climate modeling. This morning we've started out with an overview of climate and climate modeling by Samantha Oestreicher. We'll be alternating between lectures and hands-on computer modeling.
I'll be trying to live-blog it, more or less.
Here goes! Some notes from Samantha's talk.
What is climate? Climate versus weather: "Do I need to own an umbrella?" versus "Do I need an umbrella today?"
How do we observe climate? Data comes from many sources:
- Air: Mauna Loa CO2, since 1960s. What causes the little up and down wiggles? Seasonality. Majority of land is in northern hemisphere, so in summer CO2 is going to go up because of biomass. Some of the changes in slope of the average graph can be pinpointed to “drought here” or “floods there.”
- Satellites: can look at color and reflectivity of surface. Also only data from recent past.
- Ocean data: ancient log books from sailors recorded salinity and wind data. Gliders can explore the deep ocean today and send back data by satellite.
- Trees & forests: ecological data. Tree growth data. Bark beetles — range of population tells us something about mean winter temperatures or minimum winter temperatures recently.
- Core samples of ice from Antarctic. Look for places with little sublayer mixing. Have little tiny samples of ancient atmosphere up to 80,000 years ago (check this #!). Ice core data has good resolution.
- Sediment data from ocean. Can go back even further in time -- 65 million years ago -- but resolution is not great.
I'm going to find the temperature and CO2 against time graphs that Samantha showed at this point. Nicl-smo.unh.edu is a site at which to learn about ice cores.
Can compare the ice core and sediment data for information on ancient times. Ice core data has much better resolution. Lots of sediment intercomparison projects. Use ice data preferentially. NOAA site on ice data.
Vostok data: nice graph by Dick McGehee plots CO2 against temperature. That graph shows how “far from typical” we are right now. Certainly the planet has experienced very high atmospheric CO2 levels — 3 or 4 times as high as today. Alligators in Antarctica, horses taking over Russia….
IPCC fourth assessment, AR4, p 96 — big picture of climate cycle. Are we in equilibrium? Look at energy in and energy out. Do notice that huge surface radiation/back radiation cycle is even bigger than sun’s contribution.
How do we model climate? Many layers to consider. Timescales from daily to seasonal to centuries to geological. We have different models for different timescales.
Two main views on how to model: no detail too small approach — all-inclusive! Or the rest is details approach: simple conceptual climate models. Big picture. How much energy from sun and where is it going?
We will concentrate on those conceptual models for this short course.
Global Climate Models: the complicated ones with details First thing: need a grid model in order to put these equations into computer and run simulations! Grids in the ocean, grids in the air, on the land. But look at latitude/longitude: maybe I get a divide by zero for ocean modeling because the grid collapses at the poles. Los Alamos does a tri-pole system — three poles on land and then ocean can be modeled without running into the divide-by-zero problem. But air modeling by other researchers is on a different grid. How can we transfer from one to another? Huge computational problem Los Alamos researchers are also interested in adjustable grid systems that have, say, tight grid over US and loose grid elsewhere -- better resolution in some places while taking into account data from elsewhere. Can this kind of modeling system be built flexibly?
Start to get big flow diagrams: Coupled land-ocean-atmosphere model.
Need physical scientists (physical, chemical, bio), computer science (from data mining, to geometry to parallel processing to time optimization) Statistics (extreme events, averaging), and math (data assimilation, numerical analysis, PDEs, dynamical systems).
Get great simulations from these: Samantha has a really nice one…… POP model? Found it! Look at the Parallel Ocean Program Simulation youtube video!
Conceptual Climate Models -- the big picture. Energy balance models:
Temp change = energy in - energy out
 is Stefan-Boltzmann law, simplest rule. Just black-body radiation. 5,778K is temperature of surface of sun, so power flux
  of sun is
 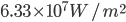 .
.
Sun is far away though, so how much do we get?
and now we get into actual math, and that will be the next post....
Pingback: Understanding climates past: more from the summer seminar | Earth Calculus
Pingback: Snowball earth… last talk at climate model summer course | Earth Calculus
Pingback: Earth Calculus-Live-ish blogging the MAA NCS Climate Modeling course | Social Mathematics