
These are notes from the last talk of the MAA North Central Section-sponsored summer seminar on conceptual climate models. This talk by Anna Barry tied together all the things we'd learned about over the past two days in discussing the snowball earth hypothesis, which tries to explain some mysterious pieces of paleoclimate evidence, and whether or not there is a mathematical basis for the idea.
So, let's get started!
What could initiate a snowball earth state?
Ice-albedo feedback, which we discussed earlier (more ice -> higher albedo (more reflectivity) -> less energy in, as more solar energy is reflected -> colder -> more ice).
Carbonate weathering: Atmospheric CO2 dissolves in rainwater, makes carbonic acid. This reacts with calcium carbonate and produces calcium bicarbonate, and this remains in solution. The process draws CO2 out of the atmosphere. In colder climates this cycle happens more easily, causing another feedback loop. Geological story related to this: 720 million years ago big continent at equator was starting to break up. For many millions of years the continents were concentrated at the tropics. Breaking up of super continent Rodinia led to excessive carbonate weathering, a large CO2 sink. This drawdown of CO2 would continue until the ice margin invaded the tropics where the continents located, and then we’d be so far into the snowball earth scenario we couldn’t avoid it.
What is the evidence supporting snowball earth hypothesis?
Glacial debris near the tropics, dropstones dropped into sediment (not floated in). Above these glacial deposits there are hundreds of meters of carbonate rock (great pictures available!). The overabundance of CO2 as glaciers retreat led to a hothouse climate, which led to carbonates precipitating out and make sediment.
Paleomagnetism. When sedimentary rocks form, magnetic minerals in them tend to align with the earth’s magnetic field. Direction of alignment in rocks tells us where they were formed. (In cool pic, looks like rocks are aligned vertically, for instance — those rocks were formed nearer poles). (I think I missed something important here, though, should check with an expert.)
Banded iron formations: in the snowball scenario, oceans would have been deprived of oxygens. In the absence of oxygen, iron is soluble in water. When the ice melted, oceans would again be exposed to oxygen and iron would precipitate out. Beautiful banded formations have been found (and in fact started the snowball earth hypothesis)… Why bands, though, instead of just one big band or two? Hypothesis: alternation between snowball and Jormungand (“pulsating” Jormungand state) could have formed them. (Remember that the Jormungand state is the one where there’s a narrow strip of non-frozen land around the equator.)
Carbon 12 and carbon 13 in geological record. Plants like carbon 12 better in photosynthesis. An overabundance of carbon 12 at any given time suggests plants are doing poorly. There are such periods in the geological record.
Objections to snowball earth hypothesis:
There was life immediately before and immediately after. How could organisms survive or evolve?
- There are organisms in sea vents
- There are also organisms in melt ponds and sediment depressions on glacial ice shelves (Vincent 2000)
- These ponds protect microbes
- Microorganisms can be found in ecosystem that usually freeze
- McKay (2000) found arctic lakes with ice 5 meters think could sustain life
- Lake Vostok!
- We don’t know snowball ice thickness — maybe ice was thick, maybe not?
How could we ever get out of snowball earth once it started?
- Kirschvink’s 1992 ideas: volcanoes still erupting, even through the ice (so CO2 entering atmosphere, leading to warming)
- Weathering of rock stopped as all rock was covered in ice, so CO2 wasn’t drawn out of atmosphere
- Over time, enough CO2 build up to reverse snowball
Are there Any math models that would support snowball hypothesis?
Remember,
dT/dt = energy in-energy out
Remember, our simplest model predicted that it should only be 255 Kelvin on earth, but it's warmer. Why aren’t we in a snowball now? We have an atmosphere. Fourier (1827) discovered greenhouse effect.
Modify our Stefan-Boltzmann law to have energy out be  . Inverse relationship: more greenhouse gases means epsilon smaller, fewer means epsilon bigger. Plot energy in and energy out against each other and get three equilibria. Analyze these equilibria: snowball and ice-free are stable, while mid-latitude ice caps give an unstable equilibrium.
How does phase diagram change as we increases or decrease greenhouse gases? As greenhouse gases decrease, more outgoing longwave radiation and top two equilibrium points draw closer. As greenhouse gases increase, less outgoing longwave radiation and the other two equilibria come together. If we decrease greenhouse gases enough, the number of equilibria collapses to 2 and then just 1 equilibrium point. Likewise, increasing greenhouse gases causes lower two equilibrium points to come together in a saddle node bifurcation and then we’re eventually left with one hot planet. Can make a bifurcation diagram from this and get a big S-shaped curve (depending on your axes!).
Tipping points
Anna had a nice demo with a “catastrophe machine” — we learned the word “hysteresis.” In this context, hysteresis is a situation when we can’t go back just a little bit to reverse our state -- for instance, we can't just decrease our atmospheric CO2 to what it was ten years ago -- because (in math terms) we might have ended up on a different branch of our bifurcation diagram. I liked the demo...
Post-glacial hothouse
Ice-albedo feedback, melt ponds and high CO2 led to rapid melting of ice (Pierrehumbert). Kirschvink also thought about it. Recovery from this all might take 3-10 million years.
Then we reviewed the latitude-dependent Budyko model coupled with iceline equation. Think of the parameter A from this model as a proxy for greenhouse gases.
Abbot et al produced a particular bifurcation diagram for the Budyko-Sellers model (page 8 out of 14 on the attached pdf). A math question: is it possible to dynamically move around this bifurcation diagram? For instance, can oscillations between snowball and hothouse states be produced? (A on horizontal axis, ice latitude on vertical axis).
Put together two ideas:
- Marshall, Walker, Kuhn:
 . Then
 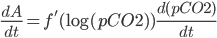 , with f' negative and constant to leading order.
 - Hogg (2007) suggested "change in CO2 = volcanism - weathering + ocean outgassing"
We’ll take this idea from Hogg, skipping ocean outgassing, and use the negative constant from Marshall, Walker, and Kuhn to write a simple model
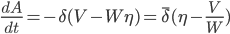
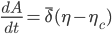
So then let  . Rewrite the system to be two ordinary differential equations: (Barry, McGehee, Widiasih):

Mathematical tools: Filippov systems (piecewise smooth dynamical systems) , Bendixson’s criterion, semigroup theory, etc. Can get snowball earth from this model.
What about comparison to the global climate models discussed briefly by Samantha in the first lecture? They use a bunch of differential equations to model fluid dynamics, chemistry, and basic physics. Does snowball earth occur in GCMs? Yes: scientists run these big GCMs until they equilibrate, and these big GCMs have settled (equilibrated) alternately on ice-covered, hothouse, and Jormungand states.
Conclusions: snowball or waterbelt (Jormungand) states are believe to have happened in the Neoproterozoic era. Ice-albedo and carbonate weathering could have initiated and terminated these states. There’s lots of evidence that these happened, and there are mathematical models (both conceptual and GCM) that support the hypothesis.