
More notes from the MAA-sponsored North Central Section summer seminar on conceptual climate models. This is from Richard McGehee's talk on understanding the climate of the past and the Milankovitch cycles. These notes give some overview, but the graphs are really important to understanding these ideas and I will work on finding some to include.
Some thought-provoking questions: If we can’t even predict the weather, how can we predict the future? If we don’t know about the climates of the past, how can we expect to predict the future? The question is somewhat controversial: some climate modelers feel we only need to understand today and then we can play it all forward using big general climate models.
How do we know the climates of the past?
Lake Vostok, Antarctica. 2.2 miles of ice on top of a tiny little pool of water down near the earth. Scientists have taken core samples from here and “gone back in time.” “Isotopes in the ice are proxies for past atmospheric temperatures above the Antarctic”: when water evaporates from the ocean, heavy molecules tend to be left behind. Oxygen-16 evaporates preferentially over oxygen-18. Then the water in the air condenses, and of the water vapor, the heavy molecules preferentially condense out and form snow and rain. Wind pushes this air over the antarctic and the heavier molecules fall out first, and so the snow falling over Lake Vostok (which is pretty far inland) is mostly lighter molecules. (I think this is right, but should check this.)
Air bubbles in the ice are atmospheric samples from the past, and we can analyze their CO2 content. (This requires a lot more math than you’d think.)
In Petit et al’s 1999 paper, they’ve got a graph of the Antarctic temperature data (and this data can be downloaded online). We’ve managed to get back 400,000 years. Look at the peaks (the interglacial periods) and the valleys (the ice ages). We know in the antarctic temperature has fluctuated from 8 degrees colder than now to 2 or 3 degrees warmer than now.
As Samantha Oestreicher discussed, another method is these sediment samples from the floor of the ocean. No air bubbles, unfortunately, but the sediments do contain an isotopic historical record.
Oxygen-16 is preferentially evaporated and sequestered in glaciers. Thus oceanic concentration of oxygen-18 is higher during glacial periods.
Foraminifera. These are little tiny shelled organisms that make their shells from calcium carbonate. Foraminifera absorb more oxygen-18 into their skeletons when the water temperature is lower and when more oxygen-18 is in the ocean. Higher concentrations of oxygen-18 in foraminifera fossils indicate lower ocean temperatures and higher glacier volume -- colder temperatures.
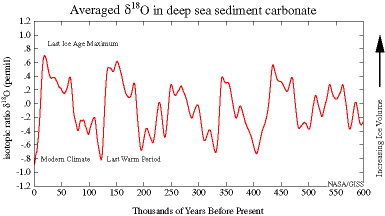
Delta 0-18 in deep sea sediment (figure from NASA)
We can then graph deep ocean temperature against time and also look at oxygen-18 in foraminifera fossils over the last 4.5 million years. Crazy growing fluctuations. Let’s focus on last million years. Looks like a rather periodic graph .
What determined the climates of the past?
Widely accepted hypothesis: variations in earth’s orbit (Milankovitch cycles) cause variation in insolation, which drive glacial cycles. Idea that glaciers caused all the interesting geology in Europe was only proposed in 1837 by Agassiz — before that people pretty much accepted that Noah’s flood washed those crazy rocks from the Alps into Germany. French mathematician built on that, proposed that there’d been many glaciers and they were related to the earth’s orbit. What a laughingstock!
While hypothesis is now widely accepted, it’s not complete: something else is also going on. The three major ingredients we'll investigate are eccentricity, obliquity, and precession.
Eccentricity: Kepler was first to describe eccentricity. There’s a difference of 3 million miles between perihelion, our closest approach to the sun, and aphelion, farthest distance -- our orbit around the sun is definitely not a circle. Winter solstice is close to perihelion (Jan 3) and summer solstice close to aphelion (July 4).
3/93 is a 3.2% change in radius, and the change in insolation is 6.4%. That's a big change in how much solar energy we’re getting, which drives weather.
Let’s compute global annual average insolation. Solar intensity at distance r from sun with output K is 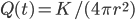 .
.
Look at angular momentum, integrate to get annual solar input and thus mean annual solar input when we divide by period. Divide by total surface area of earth to get average insolation over the course of a year.
Use Kepler’s law: period is a function of semi-major axis. Also, derived from Kepler, get  . Substitute. Can express mean annual solar intensity to be in terms of semi-major axis and eccentricity.
This is just celestial mechanics. We can compute the orbits of all the planets in the past. Laskar did this. He calculated variation of the semi-major axis of the earth-moon barycenter over 500 million years (250 into the past, 250 into the future). The length of the semi-major axis does not change much — 0.005% corresponding to a .01% change in global average insolation.
Ok — plot last million years of eccentricity. Look at two periods of about 100 thousand years and 400 thousand years.
Obliquity: tilt of our earth’s axis. Determines amount of solar energy that hits at various latitudes. Think about 24 hours of daylight during long summer days in arctic, dark during winter. Changes a lot from season to season! This is important: imagine that we did not have a tilt at all. Then the north & south poles would never get any energy — sun would go just right past. Instead, we get big movement of energy across latitudes.
Laskar also calculated obliquity graph.
Precession: our earth spins like a slightly off-balance top. There’s slight torque on the angular momentum vector caused by the Moon and secondarily the Sun. The greeks (Aristotle?) first studied this, using records from the Babylonians. At equinoxes they’d take note of locations of constellations, and from those Aristotle was able to estimate precession.
Laskar has that too! Note the period of about 23 thousand years.
Milankovitch cycles: Nice article on Wikipedia, actually. Look at the Wikimedia Commons image:
Top: obliquity. Second: eccentricity. Fourth from top: precession.
The belief is that the northern hemisphere causes the big glacial cycles, as we can add a lot of ice on the land up there and we’ve got warm summers. Paleoclimate people mostly agree.
There is a formula for insolation at a point on the Earth’s surface, and we can do an integral to get daily average insolation at latitute  at summer solstice. Notice only have to integrate over day, as night has no insolation…. So we can compute and plot daily average insolation at summer solstice at 65 degrees north latitude over the last (many) years.
Who was Milankovitch? Serbian math prof at University of Belgrade. In 1920 published his seminal work. In 1941 his big book. His work was not fully accepted until 1976. (Fourier first noticed green house effect in 1820-something.) Another mathematician in 1800s came up with something like Milankovitch’s theory.
What happened in 1976? Hays, Imbrie, Shackelton put together enough data to check Milankovitch's theory and they did.
A powerful tool for analysis of periodic functions is the Fourier transform. The Fourier transform is like putting in white light and getting rainbow; we will put in a time series (series of data over time) and get out power spectrum (this will have peaks indicating the periods of various patterns in the time series). Do that to obliquity and precession data and get their power spectra. **
Then they looked at temperature proxies from sea sediment data. Here they spotted the same frequencies that you see in Milankovitch cycles. 23, 42, and about 100 thousand years. 42 thousand peak is due to obliquity. 23/26 are for precession. 100 orbit is in phase with orbital eccentricity. Something nonlinear going on.
A model of future climate based on observed orbital-climate relationships ignoring anthropogenic effects does predict that the long term trend over next 7000 years is toward extensive North Hemispheric glaciation. From this perspective, humans have prevented the next ice age. We didn’t get the usual peak — and that coincides with the advent of agriculture. Have we been changing the climate for thousands of years?
Look at power spectrum of eccentricity. Dominant period is 400,000. Obliquity: around 41 thousand years. Precession index: 23 thousand years, with some weirdness when obliquity goes to zero. Look at summer solstice data at 65 north latitude and we can clearly see precession peaks, a bit of obliquity, and little eccentricity. Sea sediment data doesn’t show the 400K cycle because there’s only 400K of info available.
Using modern data instead of Hays’ old data, we have a clear 100K cycle and a 41K cycle. Look at forcing: precession biggest, obliquity next, eccentricity least. If we look at response, eccentricity seems most important. Must be nonlinear feedback going on, because the forcing and response don't line up. Look back at ice data: Zachos et al take power spectrum for climate for last 4.5 million years. The peak at 41K is biggest, the 100K peak is big, and the precession peak kind of shows up but it’s not a big deal. Why is precession so big for forcing but not response?
Insolation averaged over the globe and over the year depends only on eccentricity not anything else. Insolation as a function of latitude averaged over a year depends on eccentricity and obliquity but not on precession. So if you assumed glaciation depends on an annual average insolation instead of insolation at summer solstice, then forcing and response are aligned: obliquity and then eccentricity are important. Lots of climate people don’t like this but mathematically there’s a good argument.
So that's what we can see from the Vostok data. We can also do a Fourier transform on oxygen-18 in foraminifera fossils over last 5.3 million years. (Lisiecki and Raymo). Have very small eccentricity bump, if we look at data from 5 million years ago to today. If we look only from 5 million years ago to one million years ago, no peak. If we look at only the last million years, a huge peak corresponding to eccentricity.
This is a special transition: about 1 million years ago we switched from a 41 thousand year period to a 100 thousand year period.
What's up with the last million years? Why did the eccentricity signal become dominant over last million?
If last million years is dominated by eccentricity, what happened to the 400 thousand year cycle?
What does Budyko’s model say about the past?
Remember  is the ice line. We've got some function
  and have a stable equilibrium up at high value for (where by high I mean at a latitude nearer the north pole). This function
  depends on Q (insolation) and s (distribution). Q and s were computed by Laskar for a long time period in the past. Recall Q also depends on eccentricity, while s is a big integral. So calculate ice line and global mean temperature using Budyko’s model. The result doesn’t really look much like actual climate -- we don’t have the transition in periodicity we’d want. Look at power spectra. Well, obliquity shows up in Budyko’s model. Eccentricity (?) and precession missing, although global mean temperature graph's power spectrum hints at eccentricity.
Conclusions:
- Obliquity is largest signal until late pleistocene (1 million years ago)
- Budyko’s model that the predicts major contribution of Milankovitch cycles is due to obliquity
- Budyko’s model is a poor predictor of the climate of the last pleistocene, perhaps because greenhouse gas feedback is not part of the model.