Tag Archives: exponential functions

Lynx: the chain rule and a better model

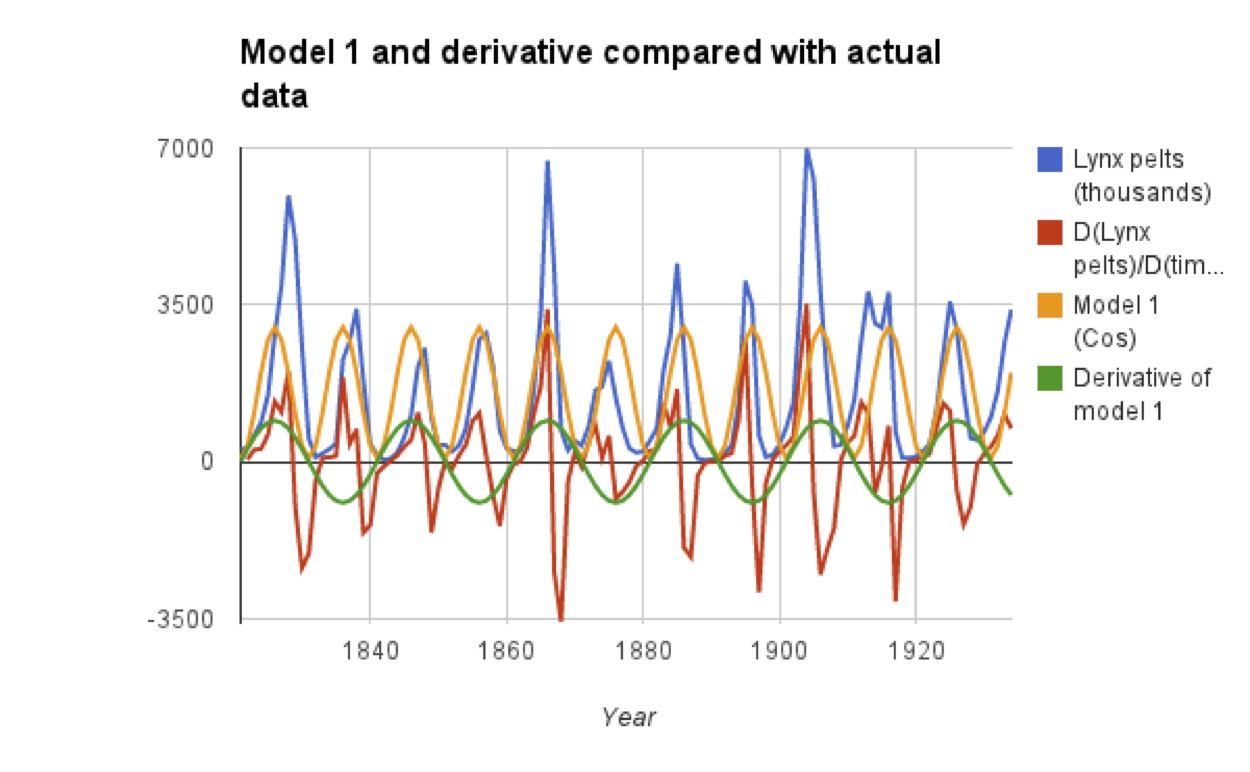
As promised, a return to lynx. In my previous post about lynx I posted a worksheet modeling lynx populations with a cosine function, and mentioned that this is not the best model. Look at the derivative to see how bad it is -- the green and red lines ought to be matching up:

LynxModel1

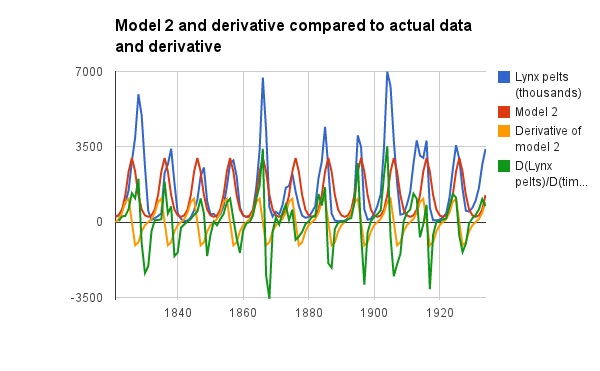
Graphing the log of the lynx data gives a transformed graph that is much more sinusoidal! The better model for the lynx data, then, is exp(something sinusoidal). Look at the graph below to compare Model 2 and its derivative to the data. The green and yellow curves are much more alike:

LynxModel2

This worksheet guides students to developing this model after having them evaluate the previous sinusoidal model via technology.

The worksheet I'll include below is meant for a day when you have computer lab time with students. I know that this does not include everyone... but if you can head down to the lab for such an activity, there is a lot students can learn!

This worksheet applies knowledge of:

  • the chain rule, on compositions of trigonometric and exponential functions
  • numerical approximation of the derivative
  • shapes of graphs.

Along the way students must evaluate models and create one of their own.

As the instructor, you'll have to decide what software you want to use for this activity. I have had success using Excel, asking every student to email me their work on the way out of the lab, and these days you can use Google Drive if your institution uses Gmail. If you and your students are already quite familiar with R you could also use that. Beware of differences between Mac Excel and Windows Excel, especially in graphing -- work through the activity yourself on whatever platform students will use.

Chain Rule: Lynx

Lynx Pelt Data Spreadsheet

Drugs in our waterways: teaser

This is definitely one of the more complex topics we'll be discussing on the blog. Physics can be so clean -- bodies of rock moving through space, atmospheric gas escaping -- but biology, especially when we start talking about ecosystems, can be so messy! I mean literally as well as figuratively: people who work on measuring the levels of pharmaceuticals in our waterways have to wade through muck, dig through algae, and get in boats!

The presence of pharmaceuticals and endocrine-disrupting compounds in our waterways is an issue that's only becoming more pressing. I'll concentrate on Minnesota because that's where I live. Remember that flap about water bottles containing bisphenol-A? Maybe you switched your water bottle -- but you can't get away from the fact that small quantities can now be found in over 40 percent of Minnesota lakes [1]. Don't take antidepressants at the moment? Well, maybe you'll get a little when you're swimming: venlafaxine (sold as Effexor) is found in 9.4 percent of stream water samples analyzed by the Minnesota Pollution Control Agency in 2010 [2] and amitriptyline is found in almost 30 percent of lakes randomly sampled in 2012 [1]. Disturbingly, cocaine is found in over 30 percent of lakes, too -- what are Minnesotans doing?! [1] And you'd think we'd have fewer mosquitos here given that DEET, the insect repellent, is found in over 70 percent of our lakes! [1]

While the amounts we're talking about are very tiny, they still disrupt fish and mussel life and reproduction. Strangely, fish exposed to some antidepressants are more aggressive predators. Frogs exposed to birth control chemicals can reverse sex. We don't really know what happens to humans exposed to frequent low-level chemical concentrations of this type, although there are disturbing preliminary results relating endocrine disruptors to obesity, diabetes, and endometriosis. We do know that the pharmaceutical industry is hugely important economically, and there is conversation around making the industry greener.

Ok: enough geeking out about the prevalence and importance of drugs in our waterways. Where's the math?

I'm working out a worksheet that will discuss photolysis, the breakdown of chemicals due to light exposure. The rate of photolysis depends on the clearness of the water at a given depth in the photic zone (the zone that light can reach), and this rate constant can be modeled by a

  • composition of a rational function and an exponential function.
  • This function gives a rate, even though we haven't done any differentiation.
  • I'm hoping to work in a page on limits as well.

However, this post is super-long already -- so I'll  stop! The worksheet should be up today or tomorrow (Tuesday).

[1] Pharmaceuticals and Endocrine Active Chemicals in Minnesota Lakes, released May 2013, online at MPCA site on water. Dramatic graph on page 6.

[2] Pharmaceuticals and Personal Care Products in Minnesota’s Rivers and Streams: 2010, released April 2013, online at MPCA site on water. Pages 2-3 discuss venlafaxine.