Category Archives: Differential Equations

Spring fling: hairy vetch

It's spring in Minnesota, which found me flinging hairy vetch seeds from a flowerpot into the back yard.

Dirt where hopefully hairy vetch will fixate. Strawberries already started....

Dirt where hopefully hairy vetch will fixate. Strawberries already started....

Let's back up a moment. My garden fever has been ramping up; those of you who live in the great frozen north might understand the hunger to see green things. It's why all the undergrads were in shorts last week (that and we set a record of 84 degrees!). For the past few years my husband & I have tried to start seeds in egg containers, and every year something terrible happens: they blow off the porch, or they all drown in a big rainstorm, or squirrels eat them. No more. This year I marched into Eggplant Urban Farm Supply a few blocks away and made a stand. I spent what felt like an exorbitant amount of money, but it'll be less than a dollar a plant even if we have a few failures. I got a seed-starting tray and a seed heater for our cold house and some hairy vetch and inoculant for nitrogen fixation!

Nitrogen what?

Continue reading

Matrix models and DEs: an example of which when

Last week I left you with the question of matrix models for populations versus differential equations. Matrix models are discrete -- they jump from time 1 to time 2 to time 3 -- and differential equations give a continuous description relating rates of change to the quantities in the system. Bees and butterflies are both pollinators, both pretty, both summer insects (up here in the north) -- why would we use different models for the two?

First off, if you're familiar with solving systems of differential equations, you might remember that matrix methods are pretty useful in that endeavor!

  • Matrices allow you to solve systems of linear differential equations.
  • Euler's method basically reduces differential equations to difference equations/matrix methods.

Differential equations can be really hard (or currently impossible) to solve. Matrix models are computationally advantageous and let us deal with small populations really concretely. If we can chunk up the life stages of a population, as with the turkeys in last week's post, we can do some pretty slick matrix modeling.

I think it's the structure of the lifecycles and lifestyles of bees vs butterflies that drives the choice. Let's think about this: bees live in hives, the same one for a long time. We can think of a hive as a population whose health we want to model. There are different classes of bees in the beehive, but they all live in the hive at the same time. Butterflies live as individuals rather than in hives or herds, so we can't look at any population smaller than a regional one. Moreover, the migration of monarch butterflies is a really big deal. The winter monarchs -- the ones who fly to Mexico -- have very different lives than summer monarchs. They live a lot longer and in different places. It's almost as if there are two kinds of butterflies separated in time. The time and space dimensions for modeling these populations, then, are pretty different.

So, that's one set of reasons for using different modeling techniques for these different populations. Can you think of others?

Here's a fun fact, though: you can use discrete methods for some bee modeling. In fact, the Fibonacci sequence comes up in bee math! I was too busy this weekend pondering the game theory of pricing books on Amazon (suddenly relevant) to complete the desired insect life worksheet, but I found some really cool resources while reading:

Looks like I'm getting drawn toward longer projects here, like the bees and the butterflies... we'll see what happens!

Bees and butterflies: differential equations vs matrix models

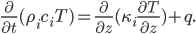
If you look back at the Basic Bees and DEs post that went up a while ago, you'll see some baby differential equations. You can write DEs as

rate of change = increase - decrease

and get some pretty cool models for populations, for instance. (My favorite is looking at predator-prey interactions: write two differential equations, one for foxes and one for rabbits, for instance. Foxes eat rabbits, so the populations depend on each other. What happens as one increases and the other decreases? Check out a puma version here.)

However, differential equations can be really hard to solve. Sometimes it's nicer to take a discrete rather than continuous approach: use a matrix model! In a matrix model, you divide time up into discrete steps: months or years or stages of life. Then you multiply a population vector that gives population at step n by a matrix that tells you how each population changes. That gives you a new vector that gives population at step n+1.

Here's a non-insect example: wild turkeys. We can classify wild turkeys as poults (ages 0-1), yearlings (ages 1-2), and adults (ages 2+). Every year turkeys get a year older, as we all do! Only yearlings and adults can reproduce. Then you can do some research to find how the population structure works:

  • The number of poults each year depends on the reproduction of yearlings and adults. So P(n+1) = F2*Y(n)+F3*A(n): number of poults at time n+1 is a reproductive constant times number of yearlings at time n and a constant times number of adults at time n.
  • The number of yearlings at time n+1 is given by how many poults survive! Y(n+1) = Q1*P(n). Q1 is less than one.
  • The number of adults at time n+1 is given by how many yearlings survive plus how many adults at time n survive. So that's A(n+1) = Q2*Y(n) + Q3*A(n). Here Q2 and Q3 are also less than 1 (no magical birth of old birds).

It seems like the literature on bees all uses DEs, while the literature on monarch butterfly populations uses mainly matrix models. This might be because of monarchs' special lifecycle: most monarch live, mate, and die up north, in Canada, the eastern US, or the midwest of the US, but some make the long trip to central Mexico to overwinter there. (There's a smaller population that has the same pattern, but with the Rocky Mountains and California replacing the North and Mexico.) The overwintering monarchs live a much longer lifespan and really have a totally different life than the summer monarchs.

I'm working on a worksheet for monarch modeling with a matrix. In the meantime, you can find educational links at Education World and Monarch Watch. Spring is the time to start thinking about butterfly activities, as the monarch migration north starts in April!

Summer!

Grades are in, just this week! Summer has officially arrived for the academic.

It's arrived in Minnesota, as well -- we've got beautiful weather, sunny days, warm temperatures. I've been trying to get caught up on weeding and planting things in the garden, since I traveled a lot this month and the days of frost were pretty recent here. Today in the garden I noticed a bee, but only one. It's not surprising that it seems like there are fewer bees than usual out and about. Bee population collapses have been getting a lot more news: the population numbers aren't good, but we still love all the fruits and vegetables that bees help to pollinate.

We're still not sure exactly why bee numbers have declined so much, but it seems to be a complex interaction between parasitic mites that have invaded bee colonies and agricultural chemicals we use to suppress other insects.

What can you do? Look up information about what plants you can grow that help bee populations. In Minnesota, check out the U of MN's Bee Lab pages! Avoid certain types of pesticides and fungicides. Talk to your Lowe's or Home Depot about not selling plants and flowers treated with neonicotinoids, a pesticide that comes up through a plant and weakens bees who collect the pollen, or buy from a smaller distributor who doesn't use neo-nics.

On the math side, there's a lot of differential equations to model bee colonies and their populations! There are quantitative models of honey bee population dynamics and mathematical model of bee colony collapse disorder. There's an online simulation you can run. You can tweak the models yourself if you know enough math, and one honors thesis I found did just that.

So on the docket, coming soon, are some worksheets or activities that explore bee populations at a few different mathematical levels. As always, I want students to have entry points into this interesting problem from a wide range of mathematical starting points!

Stefan's equation for sea ice thickness

Arctic Ice 2, Wikimedia Commons

Arctic Ice 2, Wikimedia Commons

Let's get to it! Today's worksheet is about deriving Stefan's equation. In 1891 Josef Stefan came up with a simple model for the thickness of sea ice, using thermodynamic reasoning and the data from British and German Arctic explorers. We, too, can trace through the thermodynamic reasoning. I found it harder to find straightforward sea ice thickness data for areas without snow.

To get technical here, we can start with the heat equation and some boundary conditions on the temperature at the top of the slab of sea ice and the bottom of the slab of sea ice. It's easiest to assume, though, that temperature in the ice sheet depends on vertical depth from the top of the ice sheet -- not so much on horizontal coordinates. That means we can use a model with one spatial dimension, depth . Then a reasonable simplification of the heat equation tells us that temperature depends on depth and time in the following way:

Continue reading