
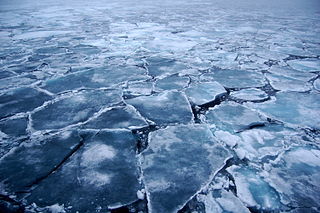
Arctic Ice 2, Wikimedia Commons
Let's get to it! Today's worksheet is about deriving Stefan's equation. In 1891 Josef Stefan came up with a simple model for the thickness of sea ice, using thermodynamic reasoning and the data from British and German Arctic explorers. We, too, can trace through the thermodynamic reasoning. I found it harder to find straightforward sea ice thickness data for areas without snow.
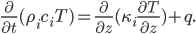
To get technical here, we can start with the heat equation and some boundary conditions on the temperature at the top of the slab of sea ice and the bottom of the slab of sea ice. It's easiest to assume, though, that temperature in the ice sheet depends on vertical depth from the top of the ice sheet -- not so much on horizontal coordinates. That means we can use a model with one spatial dimension, depth  . Then a reasonable simplification of the heat equation tells us that temperature
  depends on depth and time
  in the following way:
We'll use degrees Celsius for temperature, days for time, and centimeters for depth. Lots of parameters here, too:  is ice density, which is about 0.9 grams/cm^3,
  is the specific heat of ice, the amount of energy it takes to heat ice one degree,
  is the heat conductivity of ice, and
  depends on the solar radiation penetrating into the ice.
This is way too hard to deal with. We are all smart people here, but the specific heat and the thermal conductivity in particular depend a lot on temperature, and then solar radiation... well... this is what you go to graduate school for! This is a calculus blog!
Make some simplifying assumptions, then. A good approach to any modeling problem is assume some simplifications and then see how wrong you are! One not-unjustified assumption is that the bottom of the slab of sea ice is going to have the same temperature as the freezing point of sea water, about -2 Celsius. (It turns out in the worksheet that we don't need to know this -- we'll just call this freezing point  .) Another assumption we can make is that we can measure the temperature at the top of the sea ice. We'll call it
  . You might think that is super-reasonable, but remember that in real life snow or melt water are common on top of ice sheets. Notice that for our setup we are looking at
  as a function of time in days -- we want to know eventually what days are below freezing and what days are above freezing.
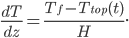
The last really big assumption is that there is a constant temperature gradient between the bottom of the slab of sea ice and the top. This is easy to phrase mathematically, by saying that
The first step of the worksheet provided is all about asking students to interpret in symbols the word problem given in italics above. It's a great time to talk about how to decode word problems.
Once we have that and simplify my crazy heat equation at the top using the boundary assumptions, something much more reasonable appears:
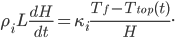
Here  (latent heat of freezing for ice) replaced , because we're looking at a phase transition (the freezing process). This number actually depends on the salinity of the water freezing, but we'll ignore that and use 335 Joules/gram, the latent heat of freezing for pure water. It's a model! This gives us a value of about 10.89 for
You can use separation of variables to solve this differential equation, being careful about time. In the end you get a very nice equation for the thickness  of the ice after days, if you know how many days were below freezing and at what temperature. In the worksheet of course all the numbers are pretty simple though you'll still need a calculator.
Baby DE and Integration: Sea Ice
There are a lot of great pictures and resources that could go with a lesson on this, and you could talk about equilibrium (discussed on the last page of the worksheet). Stefan's equation generally overestimates thickness by just a bit, most significantly because snow is an insulator, and the equilibrium values it predicts are pretty close to the truth! There are also current events (or semi-current events). Remember that there are two separate phenomena being discussed in the news, the extent of sea ice and the thickness of sea ice. If you take a look at the equilibrium part of the worksheet you could actually find the point at which sea ice melts every year....