I've been spending the last few days trying to edit some math papers I'm working on and learn more about polygon spaces. (What's the space of quadrilaterals in  with side lengths (1,2,1.3,1.8) and one vertex at the origin, for instance? If you guessed that it looks like
  , you'd be right!) It's always interesting to talk with students about what mathematicians do. They expect we do more with numbers, and when I talk about what I am working on they're surprised at all the funny little pictures I draw and all the writing we all do.
This activity is a good one for discussion. You could either print this or use a projector to put it up in front of the class for a group discussion. Group discussions can be a great way to get a class comfortable with each other and facilitate the verbal discussion of mathematics, which is another skill that must be learned and practiced. I had a hard time learning to "talk math" despite my good reading and essay-writing skills, and even now I need to gather my thoughts to produce coherent mathematical sentences in a way that I don't need to when talking about politics, for instance. I've concluded that I think about mathematics nonverbally and that the translation process simply takes some time, even now that I've had a lot more practice than your average freshman.
When I run a class discussion like this, I try to do a few things:
- Give students a minute or two to think in silence and write down a tentative answer.
- Start cold-calling students -- "Pahoua, what do you think about the first one? Jordan, what about you?" This requires a level of trust that is built over time.
- If students are right, I don't necessarily say so and move on -- I keep asking other students, and ask other students if they think the first student is right or not. I don't want students practicing the Clever Hans strategy. (Clever Hans is a horse who counted by tapping his hoof, but he just watched his trainer until the trainer looked happy and then stopped.)
- If students are wrong and I can identify the assumption that led to the mistake, pointing out that assumption can often help. "Danielle, are you assuming that the graph must be increasing?" Sometimes I ask other students for their thoughts. "It looks like Jason disagrees. Why?"
- If a student is visibly hesitant or reluctant to answer, ask for a question or the beginning of the thought instead. "Alexi, what do you think about part c? ... What strategy are you thinking of trying?" or "What do you notice first about the graph?" or "What question are you asking yourself right now?" These often prompt good discussions.
- I do try to use students names consistently as I call on them, and
- I try to keep track of who I call on and rotate through the whole class. There's plenty of research that shows that even the most enlightened and conscious instructors call more on boys than girls, etc., so bringing a class list and discreetly checking names off is an easy way of making sure you involve everyone in discussions. Telling students that you track who you ask is sometimes useful, too, because then they know that everyone will be asked and they should be prepared! Students do think that it's fair to do this, especially if you offer the outs suggested above if they are stuck.
So, with no further ado, here is a worksheet on matching graphs and stories, using the language of derivatives:
Graphing Stories and Stories of Graphs
Copyright details: The graphs on page one are:
(A) Water levels in Lake Superior measured at Marquette, MI, using data from http://www.glerl.noaa.gov/data/now/wlevels/levels.html as suggested by commenter TAO.
(B) Well water depth data from observation well 27010, with data from http://www.dnr.state.mn.us/waters/groundwater_section/obwell/waterleveldata.html
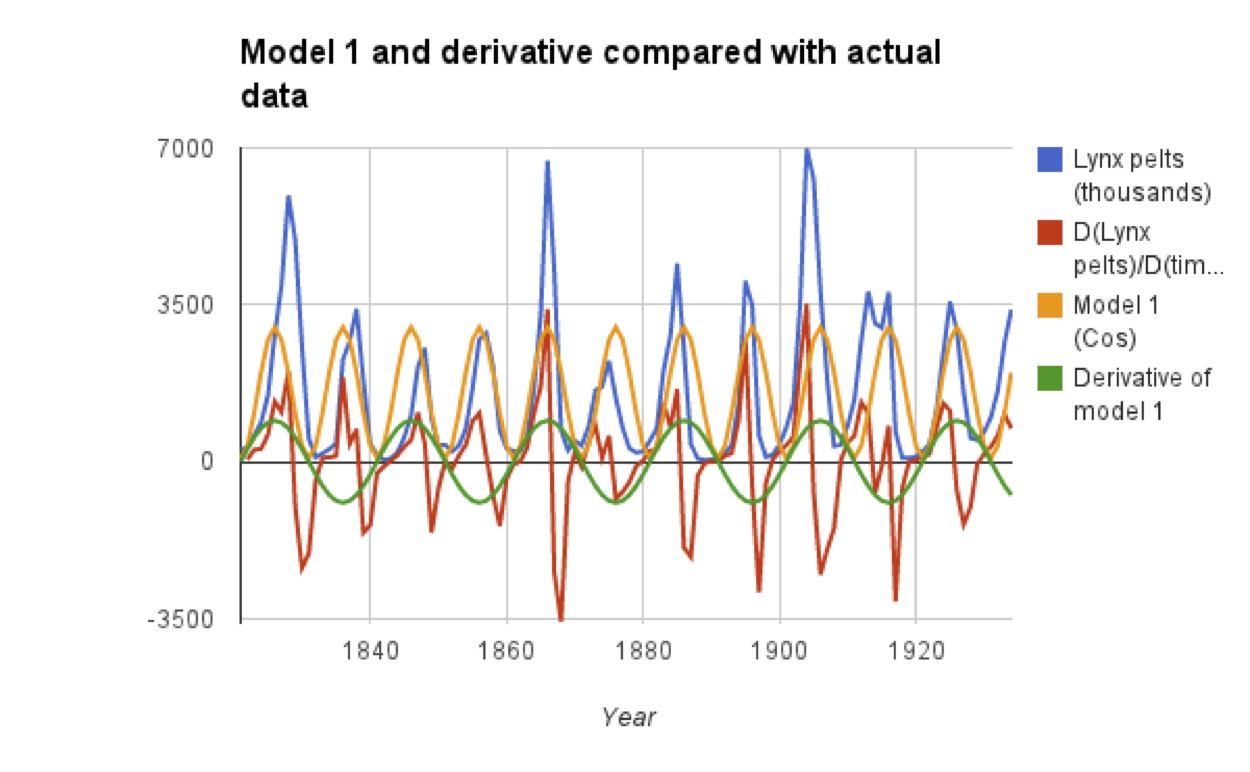
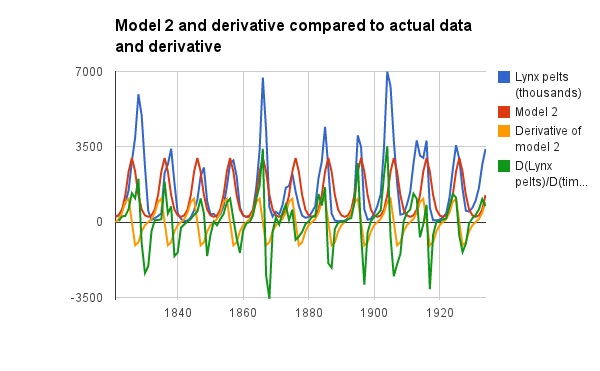
(C) Data on lynx populations using the dataset included in the R programming package. The data is from the Hudson Bay company's logs.
(D) A graph from http://www.arctic.noaa.gov/reportcard/lemmings.html, since I can't seem to find raw data for lemmings. Used under the fair use policy for copyrighted documents and documents produced by the federal government.