
Well, let's get a first pass at a monarch worksheet posted. It's definitely about matrix models and graphs, and there are a few things you need to talk about with students prior to putting it to work:
South and north: Monarchs overwintering Mexico have hit pause on their reproductive lives. Really, it's called reproductive diapause! They get to live 6-9 months down in the highlands of central Mexico, living on the oyamel fir trees in the mountains.
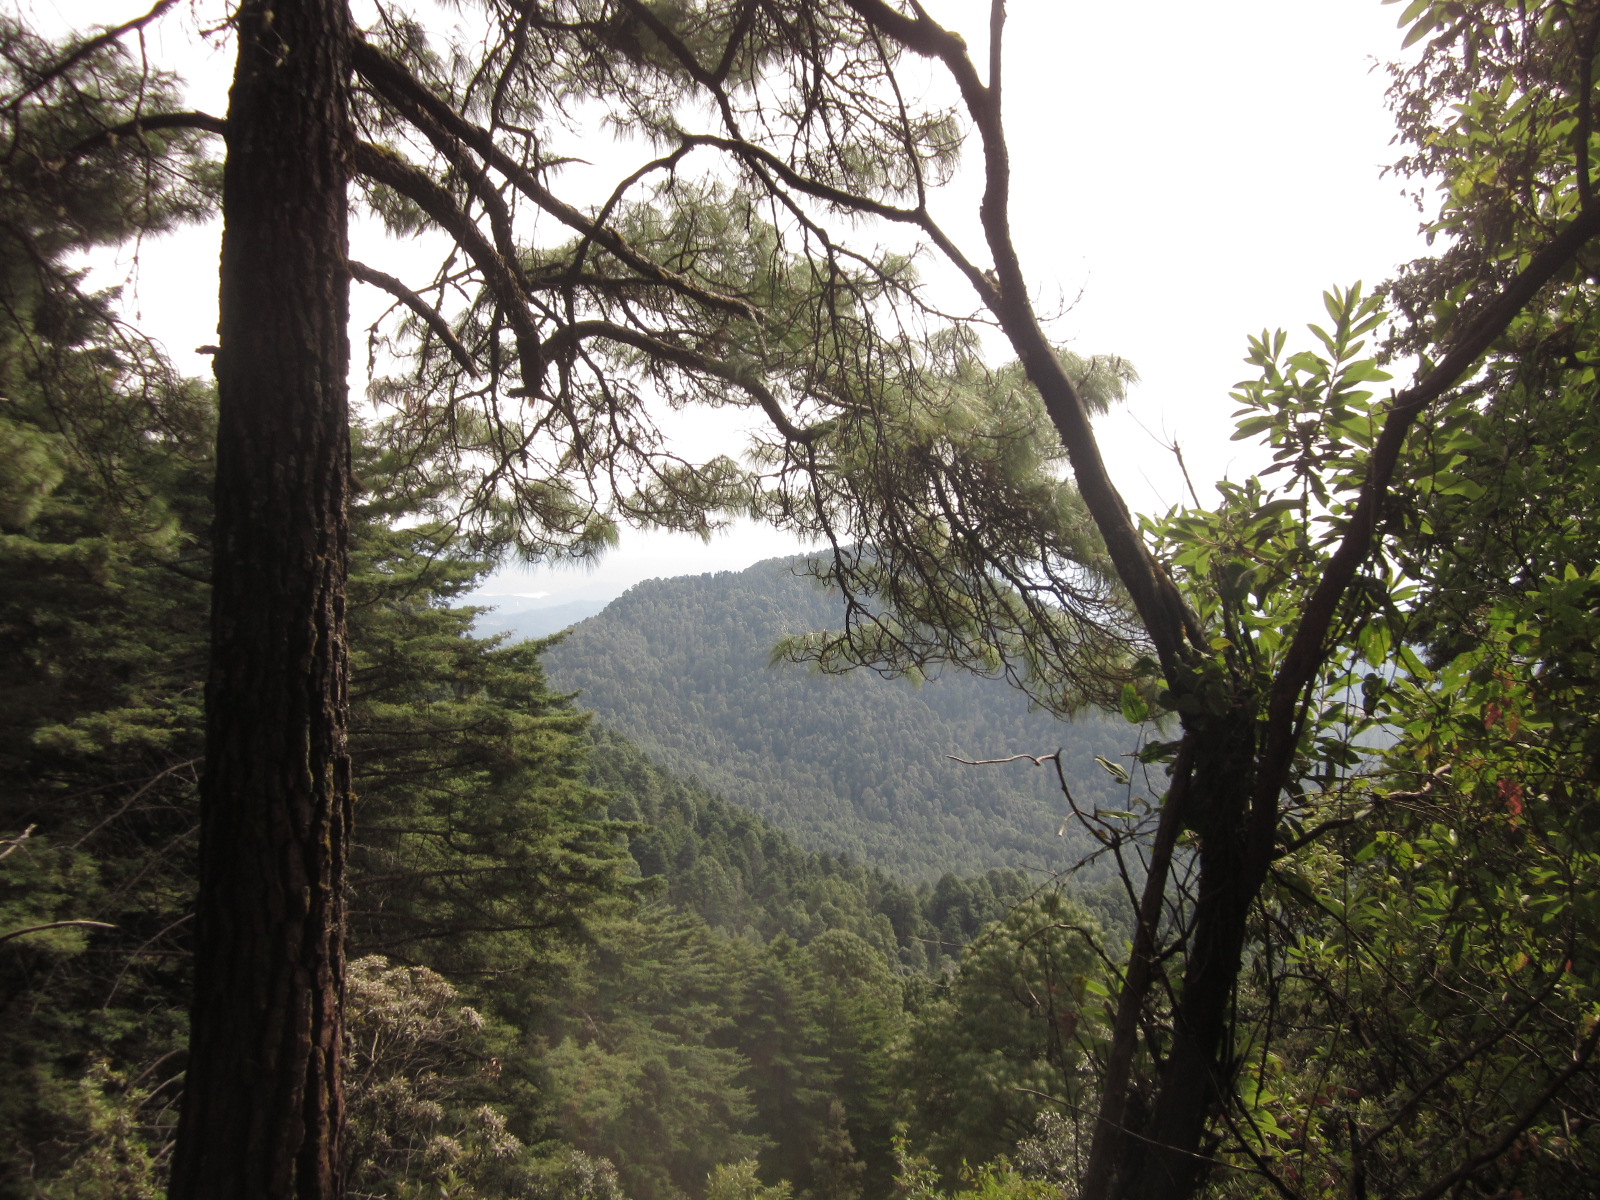 This is not a beach vacation: the monarchs cover the trees high up in the forest. I had the good fortune to visit Cerro Pelon butterfly reserve last January with Joel Moreno of Joel's Butterfly B&B, and these are pictures I took from that trip.
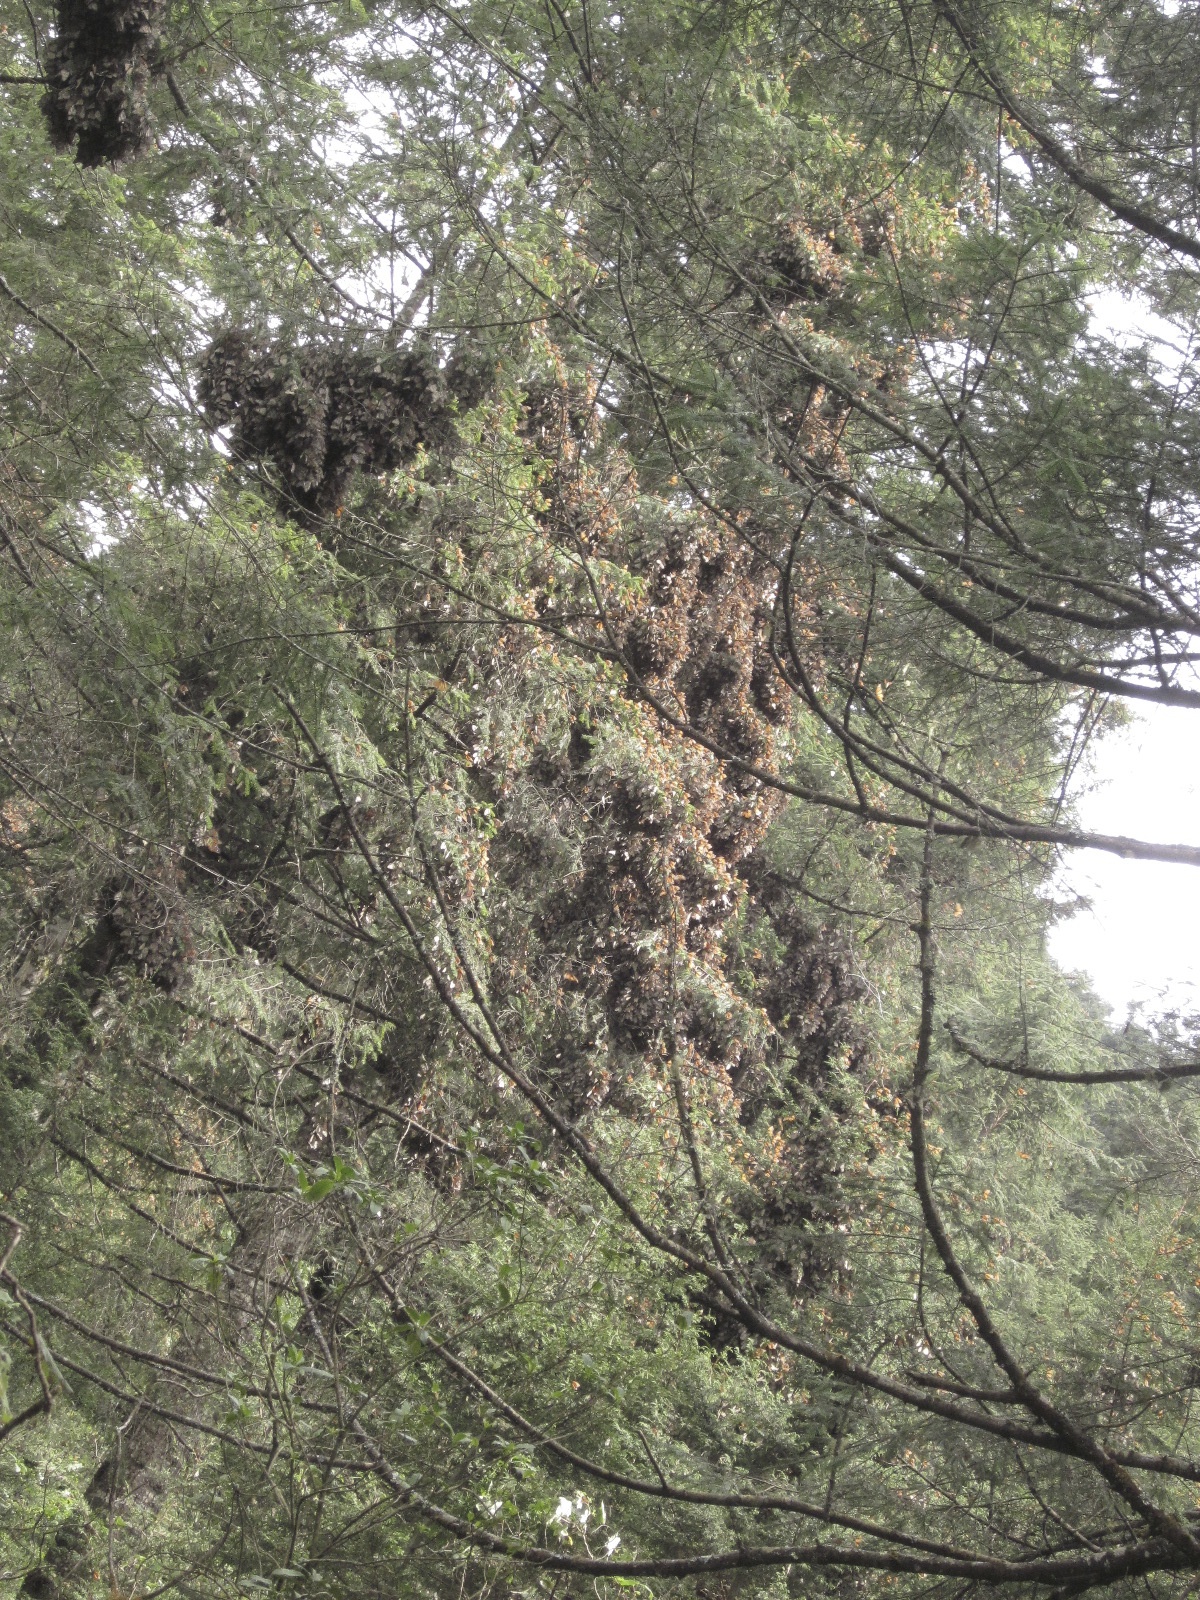
Monarchs in the trees at Cerro Pelon
The summer butterflies, up in Minnesota, Canada, and other parts of the northeastern US, only live two to five weeks and reproduce several times during that short lifespan. So in the worksheet activity, students are asked to make a graph leading from immature monarch life -- the egg, larval, and pupal stages -- to either summer butterfly life (short but wild!) or winter butterfly life (a long quiet stay in the mountains, followed by a big migration and then basically one chance at parenthood). In the worksheet I chose to break these up into two different matrices.
Matrices and graphs: The worksheet focuses on making the lifecycle graph and then making two matrices, one for summer butterflies and one for winter butterflies. Then what? I ask a conceptual question and quit. That's why I'm calling this a first draft. It's a good start for an activity, but it doesn't have the story arc I want.
I'm basing the math model on the paper by Flockhart, Pichancourt, Norris, and Martin that discusses what is leading to monarch population declines. They conclude that the biggest factor is declining milkweed habitat up here -- up north -- because in Mexico great efforts have been made to protect the butterflies, but up here we are not thinking about how our corn and soybean agriculture is affecting milkweed populations. I'd like to continue the story arc and ask students to do some of that experimentation themselves -- but if we're dealing with multiplying a lot of 5x5 matrices that's got to be a computer experiment. There's some very cool linear algebra and calculus that goes into the model used in the paper, too, so the next step in worksheets is to play with sensitivity and elasticity of the matrix model.
If you want a nice intro to population viability analysis, look here for a very straightforward explanation.
If you'd like to learn more about the monarch lifecycle or want more educational activities, check out the Monarch Lab at the University of Minnesota!