
Recently a discussion about technology in the calculus classroom reminded me to take a look at some of the spreadsheet activities I've used successfully in precalculus and calculus classes. I like activities in Excel or Google Drive's spreadsheets because they provide students an opportunity to mess with modeling on their own, and check visually that what they're doing makes sense. I like it better than Matlab, Mathematica, or Maple for terminal calculus students, in fact: they'll use Excel or other spreadsheets in plenty of other classes! There's a bit less overhead in learning how to interact with the computer.
Focus on Functions
Even students in calculus often struggle with the notion of "function." What is the input? What is the output? What does a function do?
Spreadsheet activities can help by giving students a format for understanding the function. We'll concentrate on modeling sea water level at Point Reyes, California, for this discussion. Students start by setting up the first column as inputs: the hours 0 through 24. They develop a model for the water height with respect to time, and set up a formula to use in the second column.
The rest of the worksheet asks students to graph the data and analyze their model. In any activity like this, a bit more guidance with the use of the computers is useful; I did these in a lab where I could walk students through the steps and show them how to deal with quirks of the program.
Recommendation for teachers
I definitely recommend picking the piece of software the students will be using and working through the activity once yourself! If possible, even use the same machines. I discovered to my horror once that all student lab computers had a different version of Excel for Macs than faculty had, and this version rescaled the vertical axes of scatterplots in unpredictable and illogical ways. Mac and PC versions of Excel also behave quite differently, and Google Drive's spreadsheet program used to be great and now doesn't necessarily allow pasting formulas in a column without installing an app.
The worksheet
The worksheet has three pages. In a lab class in which you just want to work through trig functions and not mess around with data much, do the first two pages and show students a graph of the real data at the end of class. If you have time to challenge students to find a better model, give them the third page as well (or allow it for extra credit!)
Trimmed Point Reyes Data, October 4
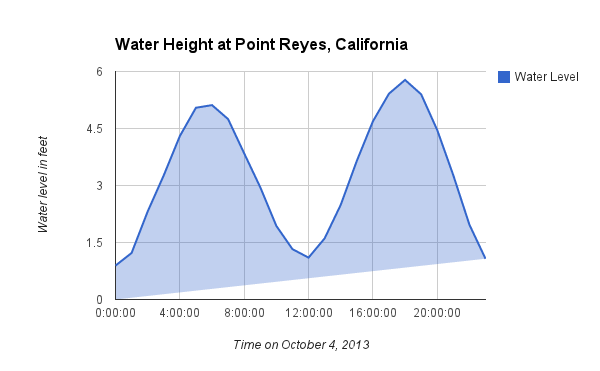
Water Level at Point Reyes, California, on October 4 2013
I should note that a lot of information I rely on for these types of projects is unavailable due to the government shutdown. Because tide and current data is judged to be vital to life and property, the Mean Sea Level Trends page is still up -- but not all the earthquake seismogram sites or the arctic sea ice observation sites!
I thought I had another numerical integration project using spreadsheets... will try to link to it when I find it...!